Lab 8 and 9: Dashboard Design Part 1 (Tableau Public)
Lab 10: Text Analysis (Tableau Public)
Lab 11: Mapping (Tableau Public)
Lab 12: Parts of a Whole (Tableau Public)
Lab 13: Timelines (Tableau Public 1, 2)
DHUMS 73000, Spring 2023
Lab 8 and 9: Dashboard Design Part 1 (Tableau Public)
Lab 10: Text Analysis (Tableau Public)
Lab 11: Mapping (Tableau Public)
Lab 12: Parts of a Whole (Tableau Public)
Lab 13: Timelines (Tableau Public 1, 2)
Lab 3: Dashboard (Tableau Public)
Lab 4: 311 Data (Tableau Public)
Lab 5: Data Structures (Tableau Public)
Lab 6: Data Joins (Tableau Public)
Lab 7: Calculated Fields (Tableau Public)
I started my Goodreads account in 2008, when I was a college student living in Buffalo. I kept adding to the list through a move to Chicago, graduate school, my first professional job in Washington, DC, and through to my current life in an even more professional role in post-Covid New York City. I feel like a hugely different person than I was 15 years ago. Is that true? If it is, is it reflected in my reading habits as tracked through Goodreads?
In honor of the books I haven’t read, I’ve used quilting squares from a quilt I never made to create some of my visualizations.
Data
My Goodreads list has 1,154 books on it and stretches over six eras:
Goodreads provides an exportable list which includes the book’s name, author, date added, date read if the book is finished, bookshelves assigned by the account owner, and three mutually exclusive bookshelves (read, to read, and currently reading). I have not assigned shelves with enough detail or consistency to be useful, so to get better categorization I uploaded the spreadsheet to Library Thing. Library Thing provides a Dewey Decimal number and detailed subject classification using the Dewey system. I added a column for location and my role at that time (student, office worker, etc.) based on date.
One challenge of the data is that I am unsure how consistently I have updated my Goodreads account over time. Another is that the lengths of time are so different for different eras. I don’t think I had a phone capable of updating my Goodreads account until at least the end of graduate school, and it is possible I didn’t have one until after I lived in DC. The longest is the time between moving to New York and the Covid lockdown (five years), and the shortest is living in Buffalo as a college student (less than a year).
Has the ratio of books marked “want-to-read” versus finished changed over time?
When I started the Goodreads account, I had a gigantic amount of shame around not keeping up with the reading at school. My hypothesis was that I would get better at finishing books as I matured. That isn’t what really happened. A line graph showing the ratio of books I read versus books I said I wanted to read by year shows the ups and downs (you can open the full graph here):
Until 2015, the ratio is under or around one (I added more finished books than want-to-read books or nearly the same). After I moved to New York, there is an explosion of books added to my want-to-read list. I added over four times as many books to the want-to-read list during my time in New York before Covid as I actually read. I had a completely false memory of adding hundreds of books to Goodreads as escapism when I was having a hard time before moving to New York, but I really started adding them at a high rate after that, when I was in a much happier mindset. When I feel happier, I feel more curious and have more varied interests, which may mean I came across more interesting books.
I may also have lost some anxiety about not finishing books. Even though my account is not very public, I think at times I avoided adding books if I was afraid I wouldn’t really finish them. The want-to-read category is also really blunt, and includes a lot of books I’ve meaningfully engaged with. For example, Peter Ackroyd’s London is a book I’ve read sections of multiple times, and I’ve even planned travel with it. But I haven’t read every chapter, and I probably won’t. That doesn’t mean it isn’t one of my favorite books, or that it hasn’t had a big effect on how I think. After looking at the data, it’s clear that the big want-to-read spikes indicate times where I’m reading a lot and getting a lot out of it rather than moments I’m failing to follow-through in some way. Looking at this has really convinced me to stop thinking about every unfinished book as some sort of moral failure.
Is there a mismatch between the genre of books I say I want to read and the books I actually read?
I thought I would see myself adding a bunch of books for smart people who keep up with things but then actually reading nothing but Agatha Christie. That is sort of what happened. I categorized books by genre using the first digit of their Dewey Decimal numbers. I then standardized as though each era was the same length of time, and multiplied by two to try and get more space at the low end of the scale. The colors represent nine different genres, the triangles are the books added to “want-to-read”, and the squares are the number of books I actually read (you can see a larger image here):
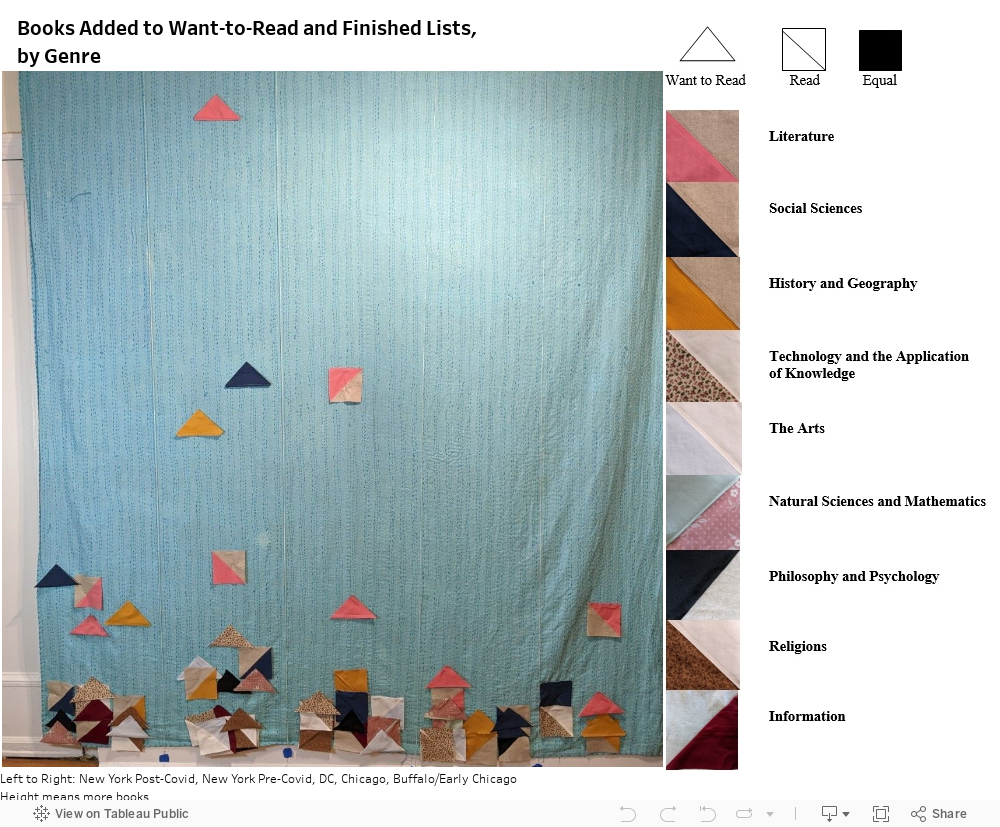
My reading is more varied than I though it was, and I needed a lot more markers than expected. “Literature” (the catch-all for fiction) is always first for books I’ve read, but it jostles for position with History and Geography and Social Sciences for books I want to read. For the most part, I say I want to read a lot of fiction and then I do.
This is another place that made me feel irritated at the “want-to-read” versus finished categories. There are a lot of books in the Social Science and History categories that I have obtained substantial information and inspiration from without finishing. The triangles aren’t really aspirational failures – when they are further along in the graph, I am reading a lot in that genre, it just doesn’t always make it to the finished category.
Has the subject matter of books I am interested in or read changed over time?
Word clouds could provide more nuanced information about the subject matter of the books on my list. Library Thing provides the Dewey decimal categorization for each book. For example, John Keel’s The Mothman Prophecies is categorized as Computing and Information > Controversial Knowledge > Information > Knowledge > Mysteries > UFOs and Stephen Morris’ biography Record Play Pause is The Arts > Biography > General principles and musical forms > Music > Rock Songs and so on. I separated these into individual words and made one long list. You can look at the word clouds here. I filtered out the big genre categories like Literature, and for the sake of legibility stuck to words that appeared three or more times.
There isn’t really a lot of change in these when constructed that way. The biggest categories are always fiction, and the most prominent subjects are crime, disease, and social problems. More health-related words started to appear when I started graduate school, which was a public policy program where I did spend some time on health policy. But most of these are physician memoirs, not anything related to serious policy issues.
The word clouds do show something familiar about my taste, but they are much more interesting to me when I stop filtering for less frequent words. I started focusing on classics (still trying to make up for the reading I didn’t do in college) when the pandemic started, and I was really hoping to see evidence of that in this project so that I could tell someone about all the classics I read. But the cloud is always dominated by social problems and homicide, because a lot of those books are faster reads or things I have foundational knowledge of already. They pile up quicker than something like The Tale of Genji or The Iliad, which I spent a lot of time on (after three years, I’m almost ready to move on from antiquity to Medieval literature). There’s a hint of it in the previous visualization: in post-Covid New York, I finished more books in the Literature category than I added to want-to-read, which I think is because I was being intentional about the classics stuff. But for the most part, the most rewarding and enjoyable reading experiences I’ve had in the past three years aren’t really observable in this type of dataset. I turned the filter off in my word cloud for the present era, and that is the only way I can see those things. But that is almost the same thing as just reading the list of books.
Recently while rewatching Teenage Mutant Ninja Turtles (1990), I wondered where the story would take place now. The turtles become Mutant Ninjas after being abandoned somewhere around Midtown in 1975 (which is interestingly the year that keeping small turtles as pets became illegal —maybe this is why the turtles were abandoned). A rat (and ninja master) named Splinter gathers them up from the puddle of radioactive chemicals (“ooze”) they are crawling in. Exposure to the ooze causes all to become human-like: they walk upright, talk, and are human sized.
I love trying to match the movie’s New York City scenes from 30 years ago to New York City today. In 2023, Midtown does not feel like a place where radioactive waste would go unnoticed—or a place where people flout the law to get their kids illegally tiny turtles. I also actually live in New York City now. I’m not that worried about illegal turtles, but I would like to know if there are really radioactive materials and hazardous chemicals lying around.
311 Complaint Data
To answer this question, I have to learn if there is a place in New York with a concentration of baby turtles that could stumble upon irradiated chemical waste. 311 logs three complaints that could help:
All data was downloaded in February 2023 from NYCOpenData.
Where are New York City’s illegal turtle hotspots?
In 1975, it became illegal to sell or own small turtles because they spread salmonella.[1] Small turtles are specifically banned because they are more likely to belong to children, and children are unhygienic. The Baby Mutant Ninja Turtles do seem illegally small. They are much smaller than Splinter, at that time a normal size rat, and all four fit inside a coffee can.
While this seems like a fairly obscure law, nearly 300 people have called 311 about it since 2010 (mostly to report pet stores rather than their neighbor’s kids). Brooklyn produced over twice as many illegal turtle complaints as Queens and nearly three times as many as Manhattan:
I am showing this with a pie chart because the turtles’ first word was pizza, and because the downsides of a pie chart don’t matter to make the point. Brooklyn has a very clear lead. The color scheme matches the turtles and their masks. I gave Michelangelo’s orange to the next biggest slice because he’s the most fun and Raphael’s red to the smallest slice because he’s annoying. Based on the pie chart, Brooklyn is the most likely location for the new TMNT.
However, a bar chart showing the zip codes with the most cases reveals worrisome hotspots (which I am defining as a zip code with ten or more complaints) all over the city. The worst neighborhoods were Williamsburg, Tribeca, and Elmhurst:
I color coded the bars according to borough to show how geographically spread out the hotspots are. I also added neighborhood names as labels to show the diversity of the hotspots for people who are familiar with New York. So far, the only borough that can be ruled out is Staten Island.
How serious are hazardous waste and radioactive material complaints?
Hazardous chemical reports are much more common than reports about radioactive materials. Between 2010 and 2022, there were almost 8,500 reports about hazardous chemicals and about 140 reports of radioactive materials. I looked at the “abandoned” subset of chemical reports, which was 2,500 cases. This seems a better fit for the movie, where the ooze is leaking out of a broken container in a pile of garbage that has collected in a sewer. A handful of radioactive material reports are related to unlicensed health care workers. I kept these cases. The Secret of the Ooze, TMNT’s sequel, blames a company called Techno Global Research Industries for creating the ooze but never says what the company does. I can’t rule out rogue health care workers without more information. (Aliens are responsible for the ooze in the comic books. It’s hard to believe that in 12 years no New Yorker has called 311 about aliens, or cryptids, or ghosts, but I don’t see it in the dataset. Maybe it’s buried in the “Animal in a Park” cases? Regardless, I haven’t read the comics so I’m working from evidence presented in the first two movies.)
I categorized duplicate reports, no further action needed, and no violations as “probably fine.” I categorized violations, referrals, further investigation needed, closed but unresolved, and unable to access as “suspicious.” I also put cases where the City mysteriously told people to call or file a FOIL request for information in this category. Outcome information was unclassifiable for about 160 cases.
The bar chart below shows the results of that system: only 24 percent (570 cases) of abandoned chemical and 16 percent (23 cases) of radioactive material complaints were suspicious. Only two resulted in violations, both related to radioactive materials: an unlicensed health care worker in Flushing, and improperly stored materials in the Upper East Side.
I wanted to look at the rates of founded versus unfounded cases next to each other because I wondered if the abandoned chemical reports were more likely to be real than the radioactive material reports. I thought that would be the case, but they really aren’t that different. I really hoped to make the suspicious bars a glowing neon green, but could not figure out how to access a full palette when building this type of chart.
I had a lot of trouble embedding my Tableau charts in WordPress. (There is a better view of this chart here.) I cannot figure out how to make the scroll bars go away. It looks like all the settings are the same as for the previous bar chart, but I can’t get the size right.
Where do baby turtles, improperly handled radioactive materials, and abandoned chemical waste converge?
Now that I know where the baby turtles and the suspicious hazardous waste are, I can find out if there are any places with all three. The map below shows the nine baby turtle hotspots. Inside each, abandoned chemical cases are shown by yellow dots and radioactive materials by orange ones. (A larger version of the map is available here).
This also gave me sizing problems. There is a lot of unnecessary white space under the map and it extends much farther outside the city than I want it to. I would prefer a normal legend, but I removed it hoping it would help the map embed better.
The map reveals two areas of concern: Elmhurst and the border of Williamsburg and Bedford-Stuyvesant. The Elmhurst area of concern includes an unlicensed worker handling radioactive material case, which the City could not investigate because the establishment went out of business. Very suspicious! The abandoned chemical reports were all referred out and are under investigation by the Department of Sanitation and the New York State Department of Environmental Conservation.
The Williamsburg/Bed-Stuy area of concern is part of a turtle triangle with Crown Heights. Those three neighborhoods produced 20 percent of the illegal turtle complaints. It has one case of improperly stored radioactive materials (which was referred out for investigation by the Department of Health and Mental Hygiene, but there is no information about where). It also has several abandoned chemical cases under investigation.
What Else Have I Learned?
311 data is frustrating at first because so many cases are logged and investigated with no findings. It seems bizarre that people are calling 311 about turtles or radioactive waste. But that’s exactly what 311 is for: I don’t have to figure out who to call if a turtle at a pet store gives me salmonella or I see a glowing green puddle. It makes sense that a lot of calls are unfounded, because it’s a resource for unclear situations. And the data then provides a great resource for more investigation. You have to be really specific to succeed at a FOIL request. If someone wanted to do a deeper dive on shady pet stores or household chemical contamination, the 311 data gives a specific list of incidents that the City gathered information on and which you could turn into a great FOIL request.
Scatterplot
Map
Pie
Bar
Line
